Introduction
The purpose of Lab 4 was to add the Inertial Measurement Unit (IMU) to the Artemis Nano robot system and be able to obtain accelerometer and gyroscope data of the robot, as well as solder a QWIIC cable to a 650mAh battery to allow the Artermis to be powered while on the robot.
Lab Tasks
Setting Up the IMU
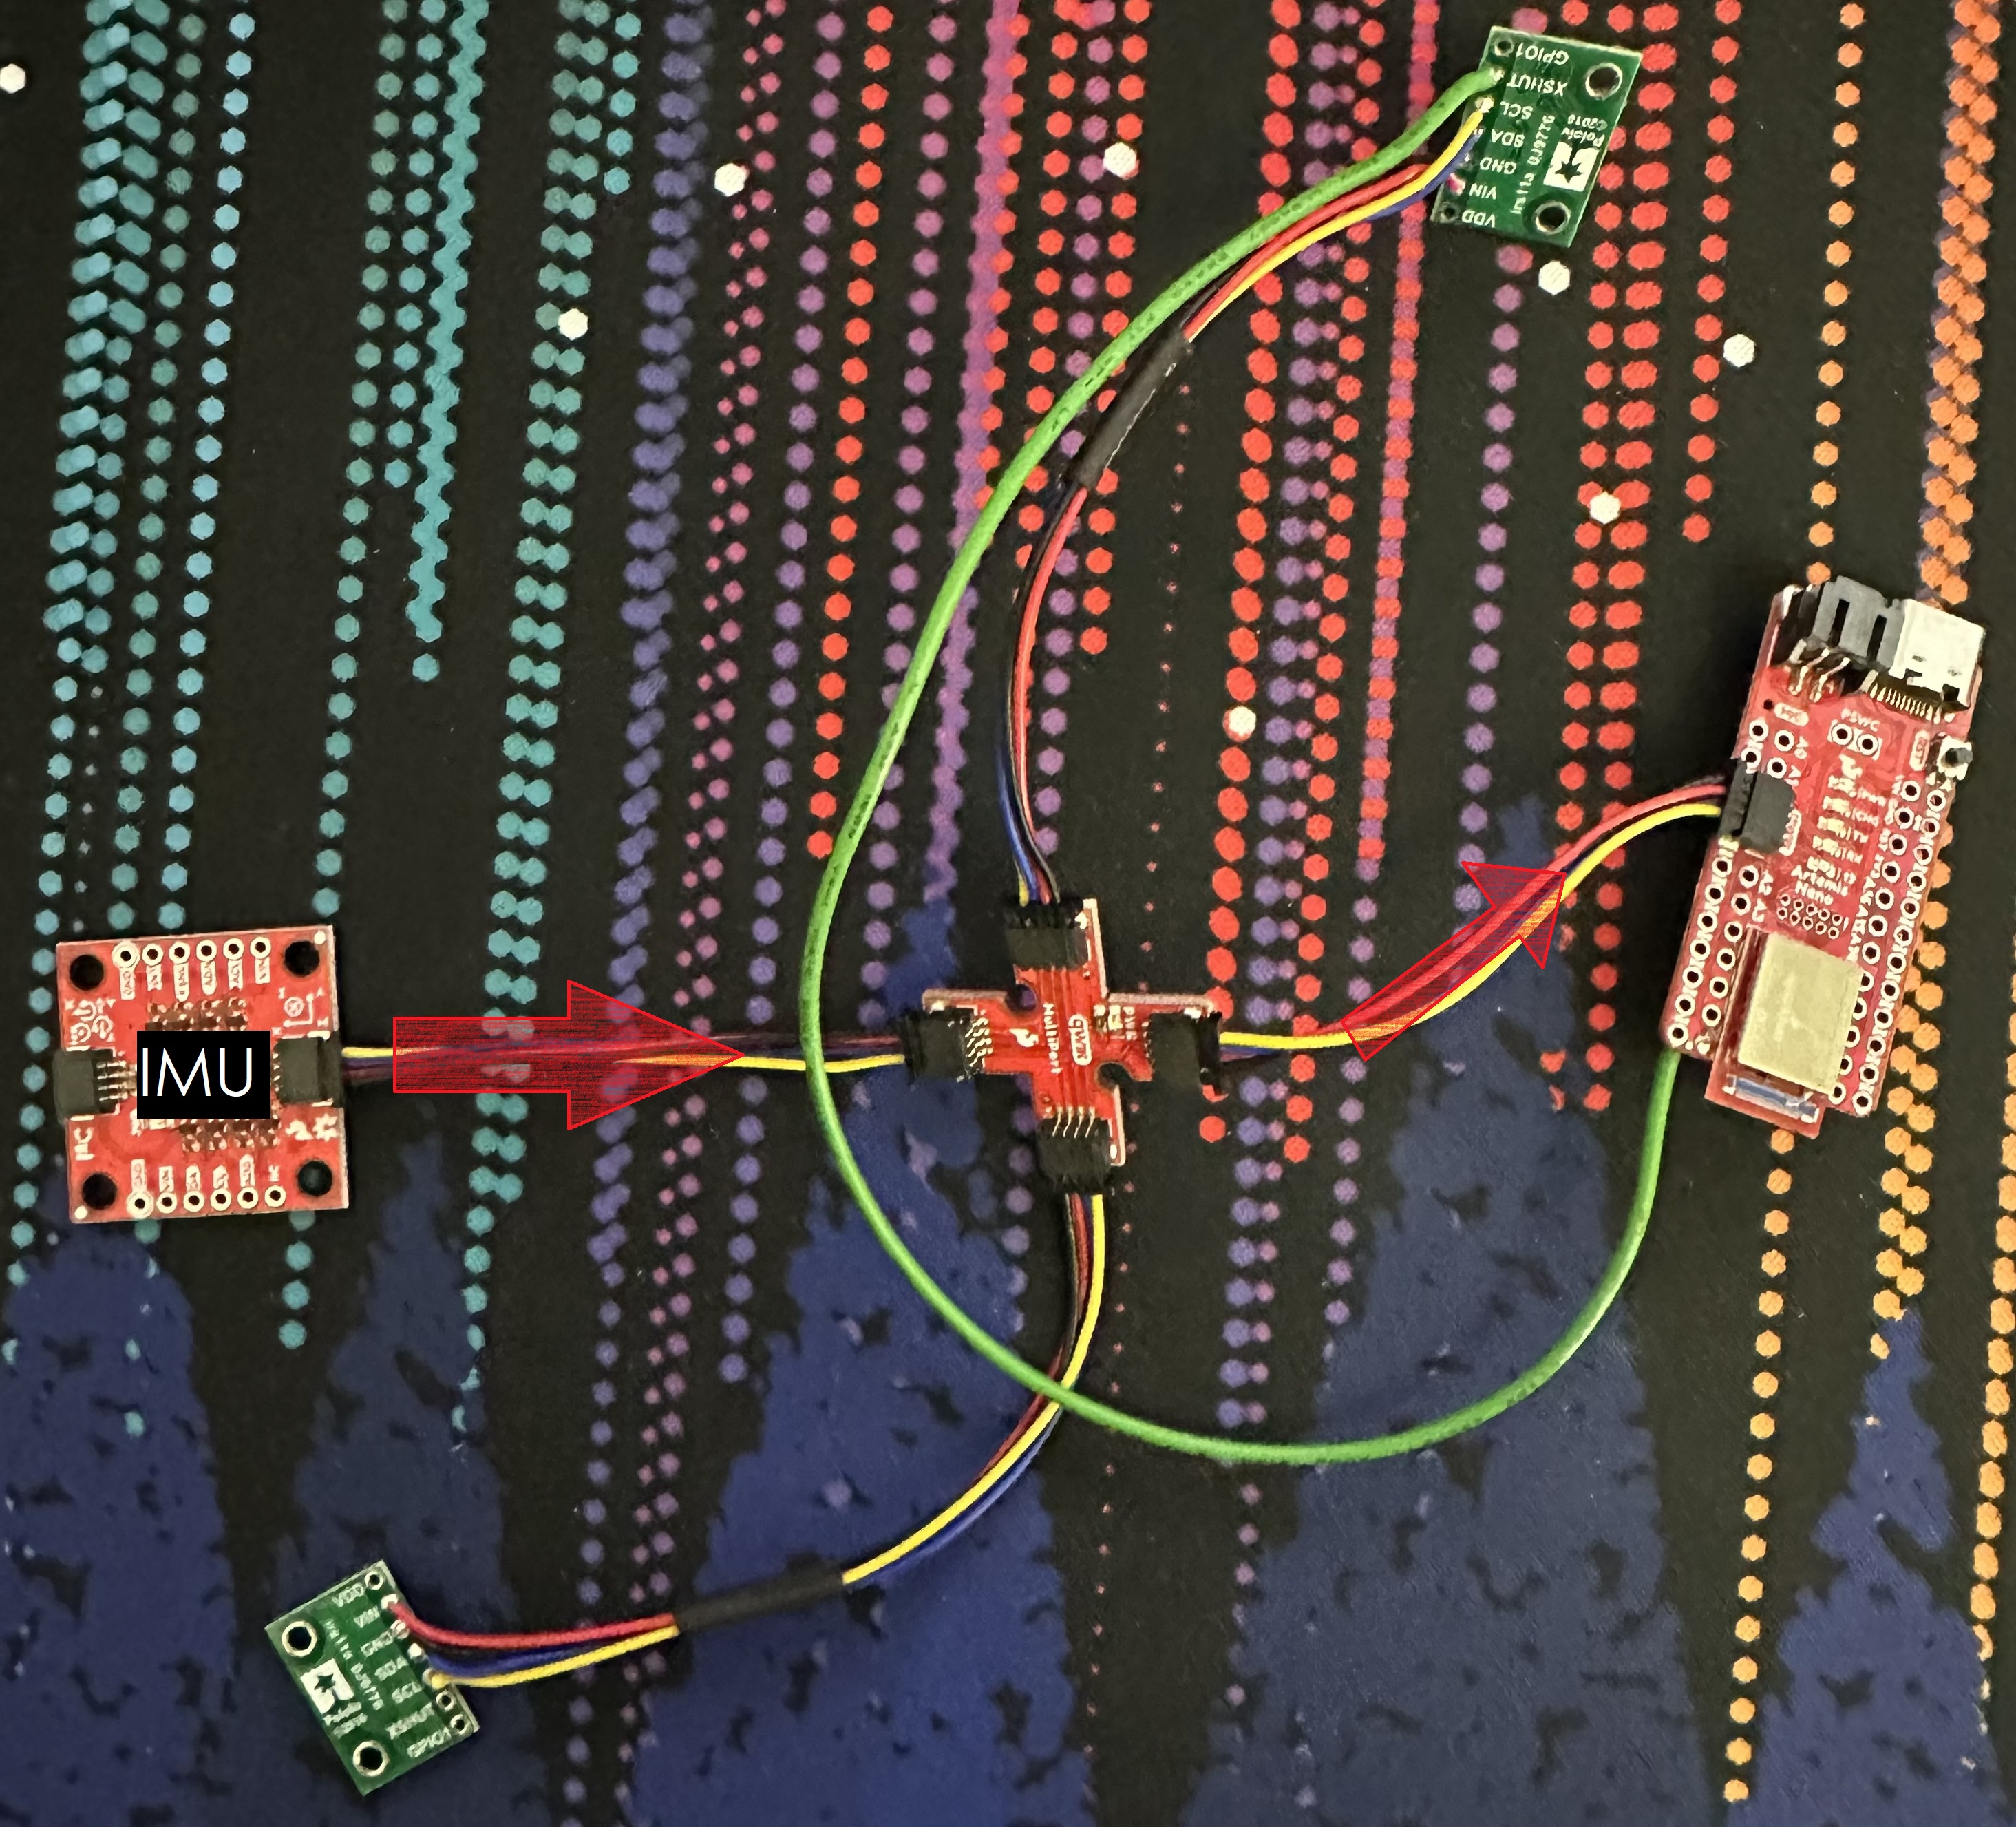
The first task of the lab was to connect the IMU to the Artemis Nano using the QWIIC cable, and run the Example1_Basics.ino example code to understand how the values of the sensors change as the board is rotated around in all axes and accelerated. Figure 1 shows a picture of the connection of the IMU to the Artemis using the breakout board.
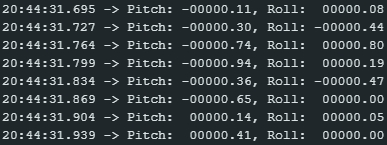
After flashing the example code to the board, the Serial Monitor produced the following output while keeping the IMU stationary and on a flat surface:

The example code defines various values including AD0_VAL. For the SparkFun IMU breakout board, since the ADR jumper is open, the value is set to 1.
After playing around with the IMU a bunch, Figure 3 shows the output of the example code with +x axis facing down, +y axis facing up, and finally while waving the board around, respectively.


Accelerometer
The accelerometer outputs the acceleration in the x, y, and z directions. Using these values, the pitch and roll can be calculated using these equations below:
Pitch = atan2(accx, accz)
Roll = atan2(accy, accz)
The images in Figure 4 below show the output of the pitch at -90°, 0°, and 90°.


Similarly, Figure 5 shows the output of the roll at the same actual angles.


Evidently, the values are relatively accurate. At worst, there was a 5% error, which was for the +90° roll.
To analyze the noise while obtaining sensor values when it is near an operating RC car, a Fast Fourier Transform (FFT) was performed. The FFT takes a time-domain signal, and transforms it into a frequency domain signal. Figure 6 shows both the time-domain and frequency domain signal for the pitch while the Artemis and the connected IMU was placed on top of a powered-on RC car.
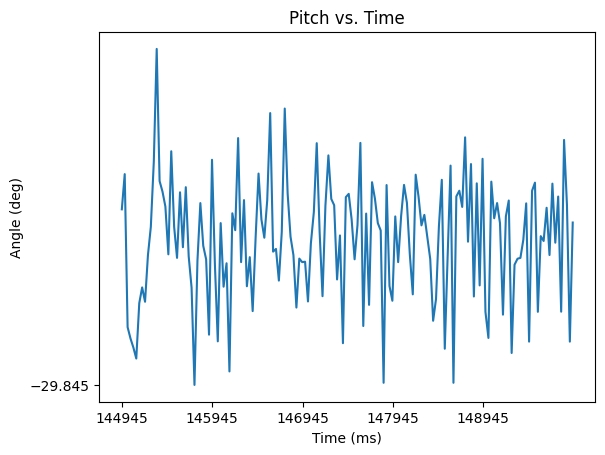
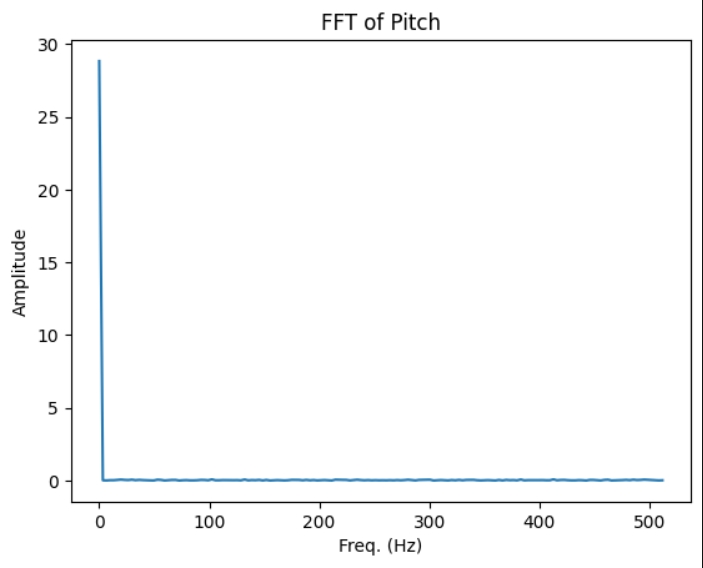
Evidently, there was a large amplitude for near-0Hz only, and so the noise should not be a problem.
Gyroscope
The gyroscope outputs the change in rotational direction along the x, y, and z axes. Using these values, the pitch, roll, and yaw can be found using these equations below:
Roll = Rollold + gyrx * dt
Pitch = Pitchold - gyry * dt
Yaw = Yawold - gyrz * dt
The video in Figure 7 below shows the output of the pitch at 0°, -90°, and 90°.
Evidently, the gyroscope deviates really quickly from the actual value of the roll, pitch, and yaw. In the video above, the pitch had already reached -6° before I picked up the IMU to put it into the -90° position. The graph below also shows the steady increase in roll and decrease in pitch, during a period of time when the IMU is held in place.
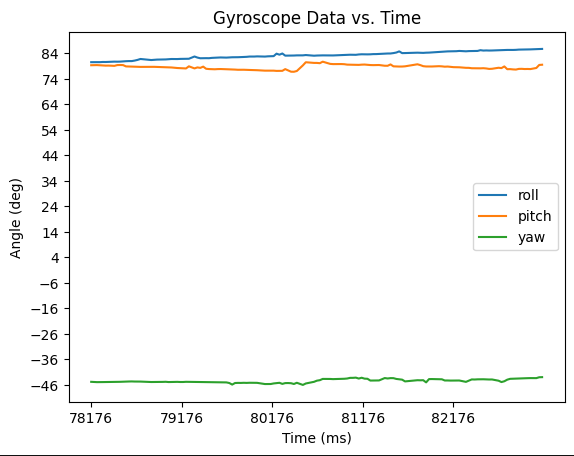
Hence, a complementary filter is crucial for accurate data. I designed the filter below to take 0.9 of the gyroscope output and 0.1 of the accelerator output and give the roll and pitch as sums of these calculations. The video below shows the same experiment as above going from 0° to 90° to -90° using the complementary filter.
Sample Data
To allow for the Artemis to send the IMU data over BLE while it is strapped to the RC car, the updated Bluetooth code from Lab 3 was updated again, by adding a way to trasmit the IMU data. Effectively, the example code, as discussed earlier, was copied over to the BLE code, adding new case statements and command types for pitch and roll. These new cases can be seen in the snippets of code below. All delays were removed to ensure best execution time.
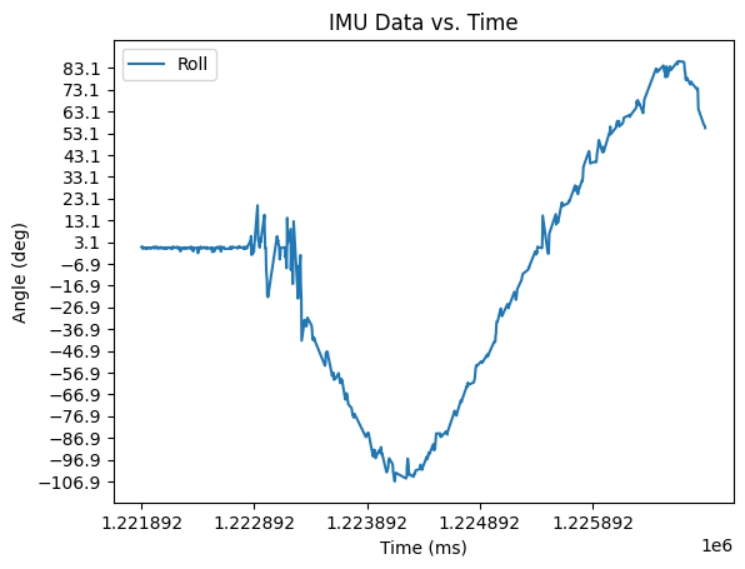
Evidently, the pitch and roll is being stored in arrays of 5 at a time, and being transmitted over BLE alongside the time stamp for each. The plot in Figure 9 below demonstrates 5 seconds of the roll data being sent over BLE, as the board was rotated approximately between -90° and 90°.
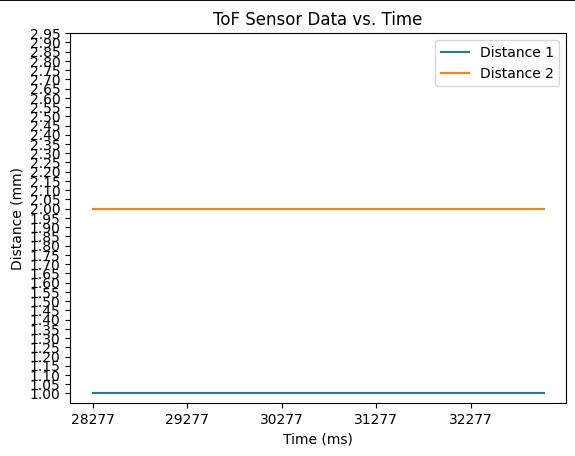
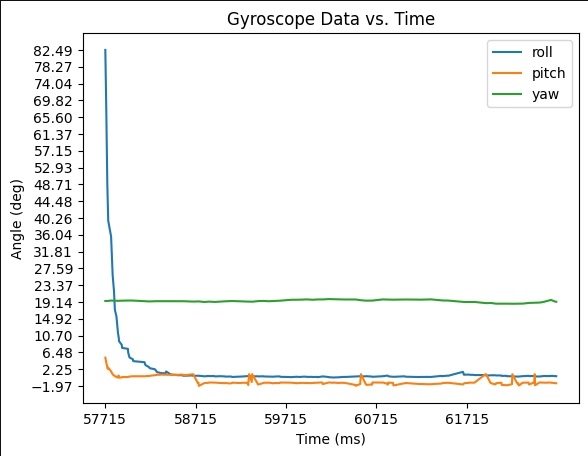
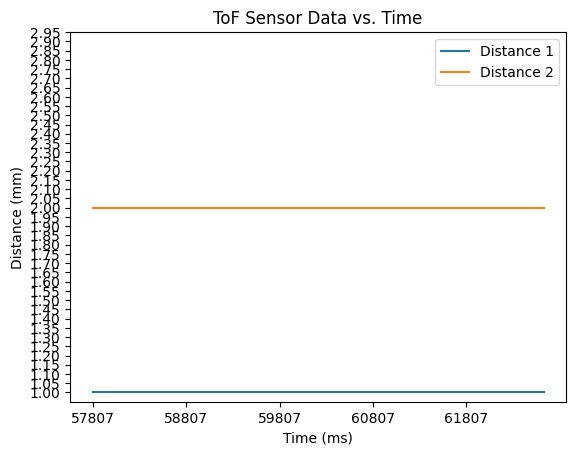
Next, I combined the IMU data with ToF data and sent it over BLE. To ensure that all data is sent, I reduced the array size to 2, so that only two values of roll, pitch, and yaw, as well as ToF distances would be sent at one time. Also, for easier processing on the Python side, I sent the ToF data separately from the IMU data. The Python code that processes both of these strings can be seen below.
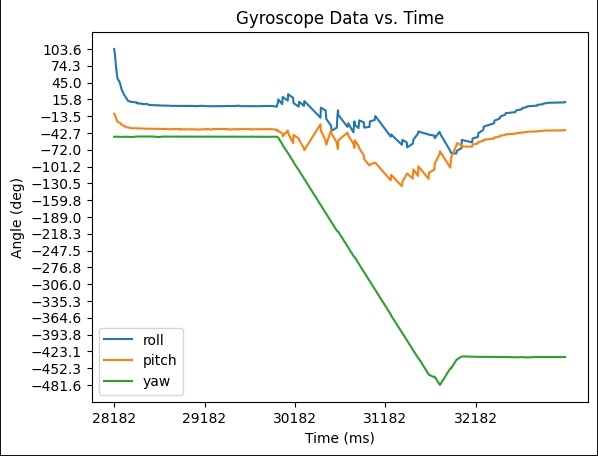
Figure 11 below demonstrates both data being sent via BLE as plotted using matplotlib's pyplot.
Cut the Cord!
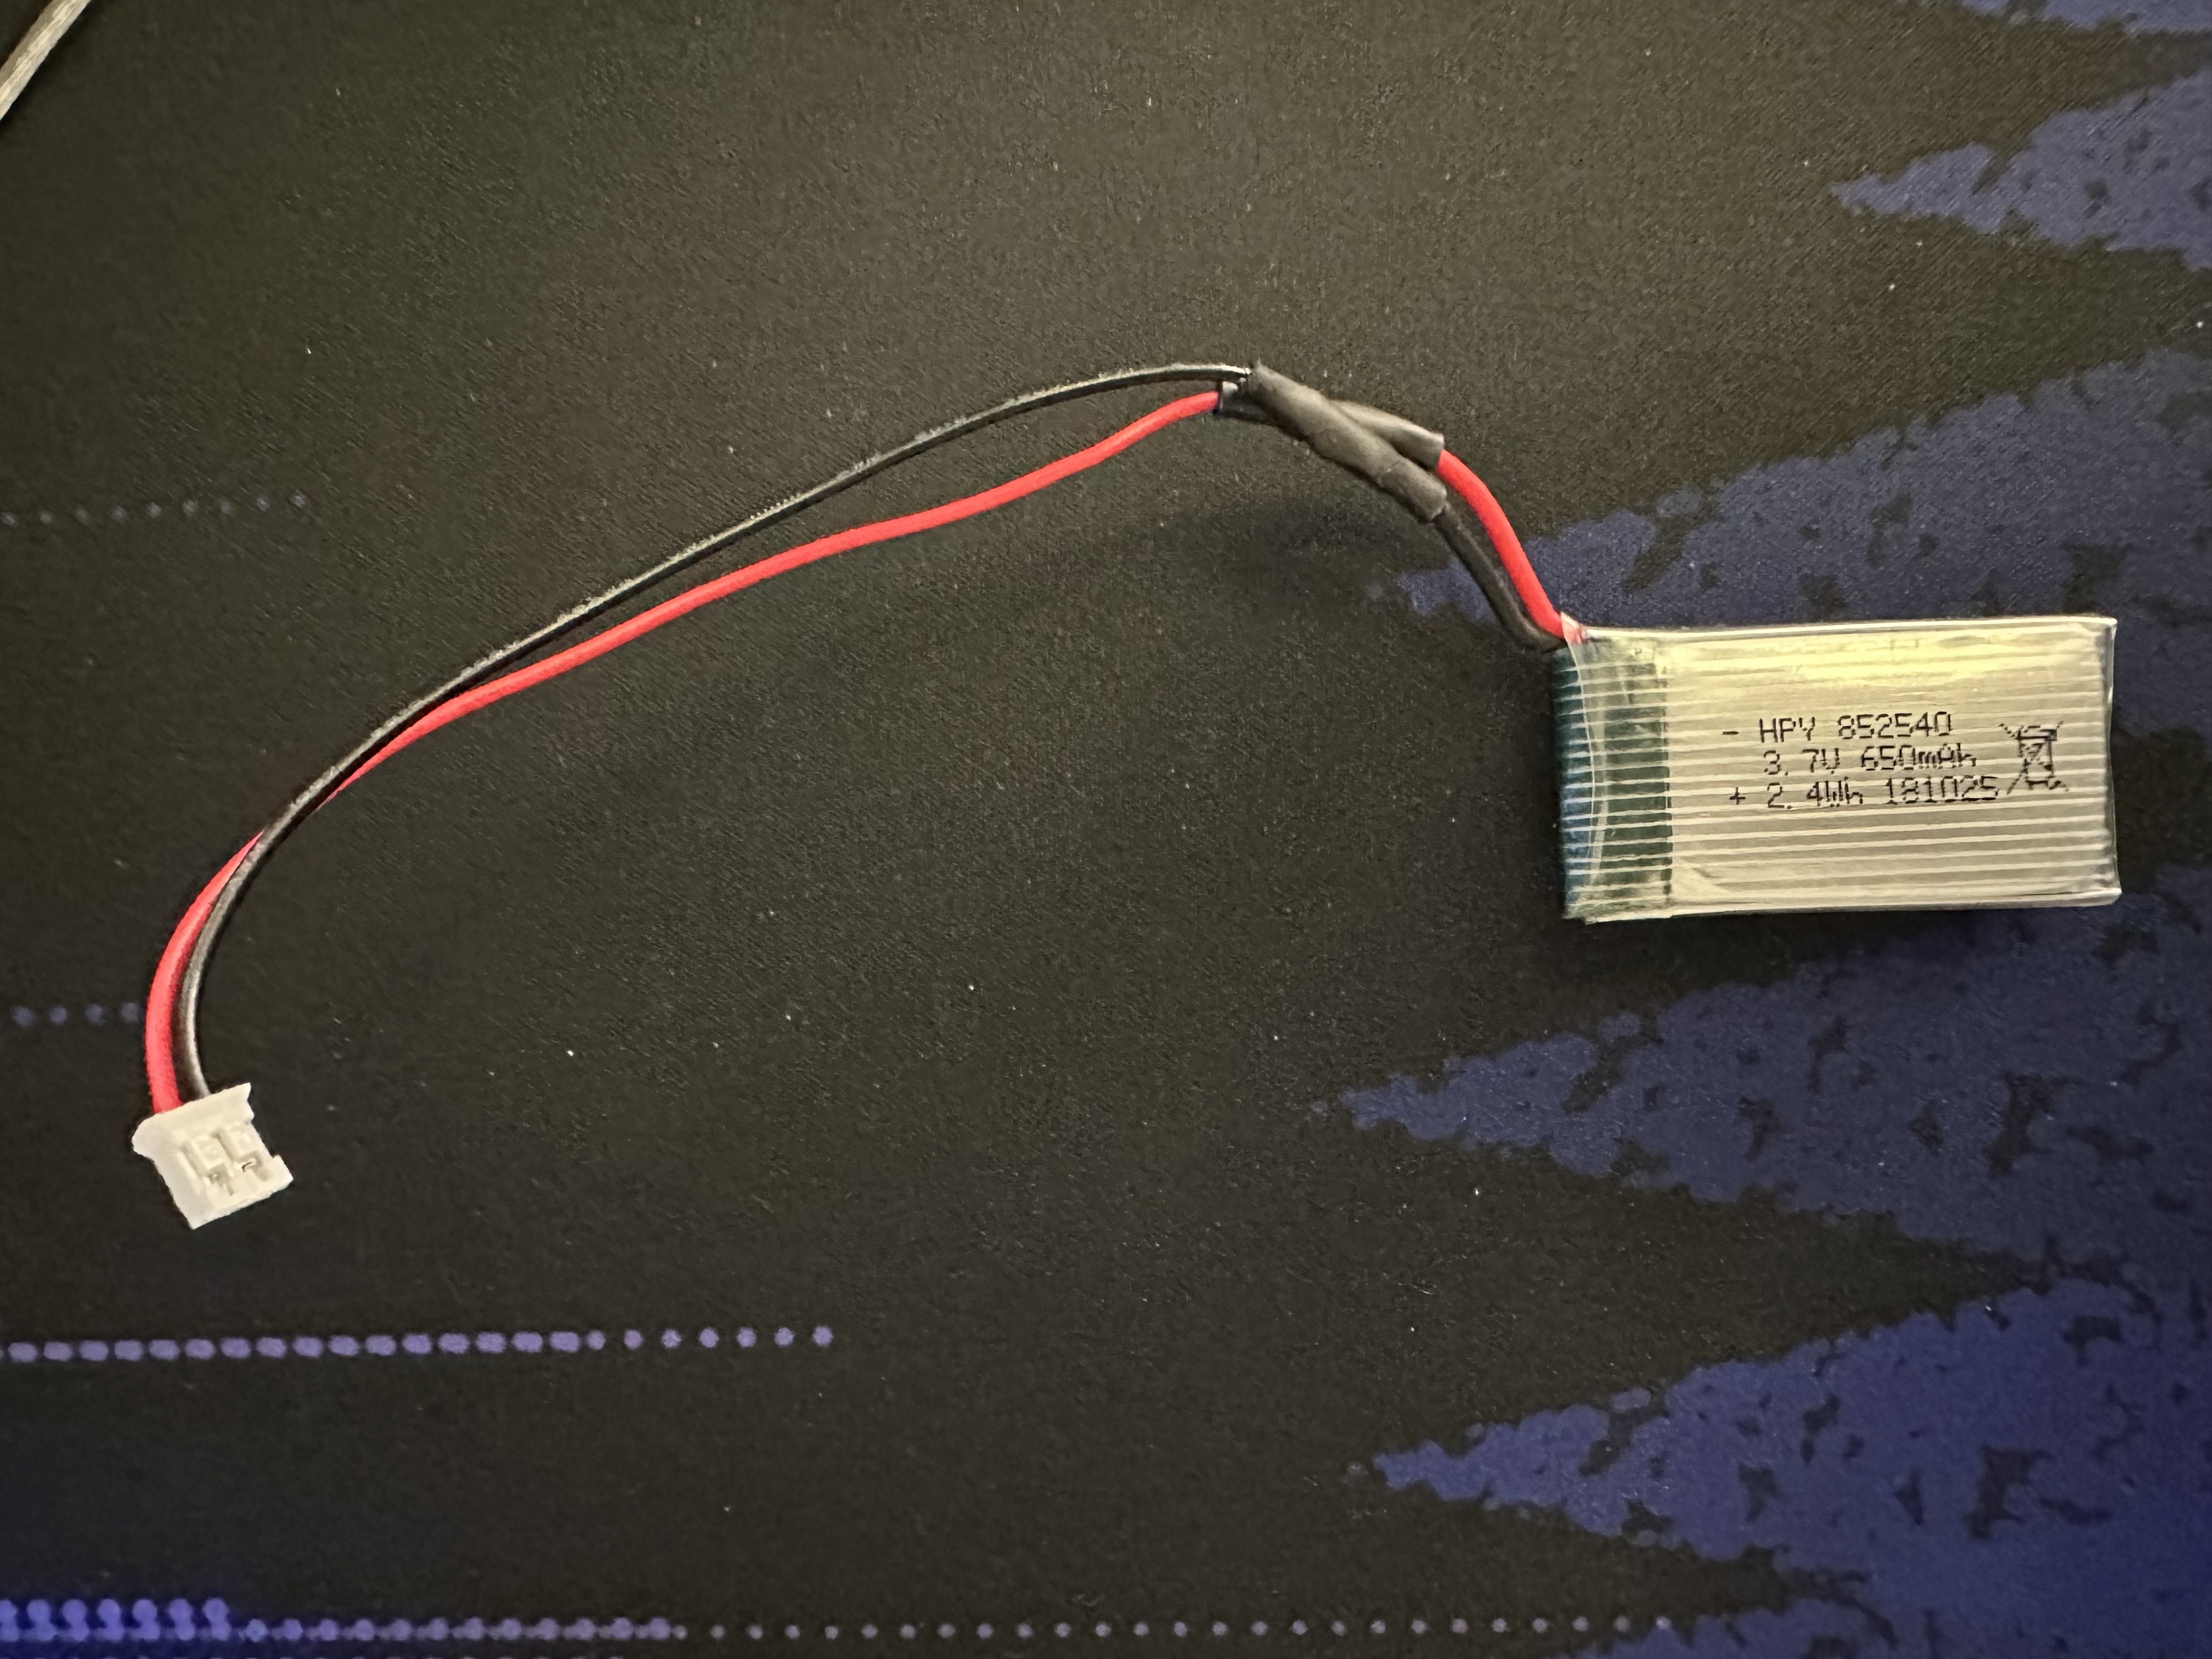
The next task of the lab was to solder a QWIIC cable to one of the 650mAh batteries. First, I cut off the wire sheathing of the black and red wires, making sure to cut it one at a time. If I were to have cut it both at once, a short would have been created with very little resistance between + and -. Next, I soldered each of the wires to the two wires of a QWIIC cable, ensuring that the polarity of the plug matches the polarity of the battery. Finally, I applied heat to fit a heat shrink over the point of soldering. The image in Figure 12 below shows the final product.
Stunt with RC Car
The final task of the lab was to record a stunt on the RC car, while having the Artemis and the connected IMU strapped to the car, so that it can send the IMU data over BLE to the Jupyter Notebook for analysis. However, before that, I first played around with the RC car to discover all of the cool tricks that it can perform. The video in Figure 13 shows the car turning continuously.
After strapping the Artemis to the RC Car, Figure 14 shows a plot of the ToF and IMU sensor data over 5 seconds, as was sent over Bluetooth, while the RC car performed the same stunt.
